Chromatic voice leading in dichords
Our Mӧbius strip can be used to represent any chord progression and any voice leasing between two-note chords. Tymoczko, Dmitri. Dmitri Tymoczko, “A Geometry of Music”, page 73
Introduction
This notebook is a demonstration of Orbichord, a project to explore topologically non-trivial space of music chords that are global-quotient orbifolds, see references:
Project page: https://orbichord.github.io
Project Github: https://github.com/orbichord/orbichord
Tymoczko, Dmitri. “The geometry of musical chords.” Science 313.5783 (2006): 72-74.
Callender, Clifton, Ian Quinn, and Dmitri Tymoczko. “Generalized voice-leading spaces.” Science 320.5874 (2008): 346-348.
Dmitri Tymoczko, A Geometry of Music: Harmony and Counterpoint in the Extended Common Practice, Oxford University Press, 2011.
Orbichord comes from combining the words orbifold and chord. It is a collection of python modules build on top of music21 project.
Importing modules
Import music and graphite modules
[1]:
# Import music modules
import itertools
from music21.scale import ChromaticScale
from music21.interval import Interval
from music21.stream import Stream
from numpy import array, inf
from numpy import linalg as la
import networkx as nx
from orbichord.chordinate import EfficientVoiceLeading
from orbichord.graph import createGraph, convertGraphToData
from orbichord.generator import Generator
from orbichord.utils import renderWithLily, playAudio

# Import graphic modules
import pandas as pd
import holoviews as hv
from holoviews import opts, dim
from bokeh.sampledata.les_mis import data

hv.extension('bokeh')
hv.output(size=180)
defaults = dict(width=300, height=300, padding=0.1)
hv.opts.defaults(
    opts.EdgePaths(**defaults), opts.Graph(**defaults), opts.Nodes(**defaults))


Configure an orbichord generator
Create a dichord generator using a chromatic scale starting from C pitch. By default, chords are identified by a normal ordered string, resulting in the space chord defined by a collection of pitch-class sets. I will also be using the normal ordered string to label the dichords to avoid any confusion because of the enharmonic equivalance.
[2]:
scale = ChromaticScale('C')

chord_generator = Generator(
    dimension = 2,
    pitches = scale.getPitches('C','B'),
    select = None
)
Chord graph
Instantiate an efficient voice leading object using the chromatic scale to define voice leading steps. Define the metric as the maximum of the absolute number of steps between all the voices or \(L_{\infty}\) norm. All non-crossing voice leading between two chords are explored using interscalar matrix computed in polynomial time by algorithm descrived in Dmitri Tymoczko, A Geometry of Music, Appendix D, page 420.
[3]:
max_norm_vl = EfficientVoiceLeading(
    scale = scale,
    metric = lambda delta: la.norm(delta, inf)
)
Use a chord graph to explore how chords are connected. For this, you need to pass a generator and voice leading objects, as well as a tolerance function. The tolerance function provides the criteria to select how close chords can be to be considered an efficient voice leading.
[4]:
graph, node_to_chord = createGraph(
    generator = chord_generator,
    voice_leading = max_norm_vl,
    tolerance = lambda x: x == 1.0
)
The output of the function is a networkx graph and a dictionary to map node to their counterpart chord object.
Visualizing chord graph with holoview
Convert the chord networkx graph into a collection of links and nodes. Visualize chord graph using (ironically) a chord graph.
[5]:
edges, vertices = convertGraphToData(graph)
links = pd.DataFrame(edges)
nodes = hv.Dataset(pd.DataFrame(vertices), 'index')
chord = hv.Chord((links, nodes))
chord.opts(
    opts.Chord(
        cmap='Category20',
        edge_cmap='Category20',
        edge_color=dim('source').str(),
        labels='name', node_color=dim('index').str()
    )
)
[5]:
The global voice leading relationships are too complicated to be fully appriciate in a chord graph. As alternative, we can explore these voice leading using discrete lattices.
Discrete Voice-Leading Lattices
Voice leading neighbors
Make a graph of all the neighbors from a given node.
[6]:
# Create neighbor graph
def neighbor_graph(center):
    neighbors = nx.Graph()
    neighbors.add_node(center)
    for node, edge in graph.adj[center].items():
        neighbors.add_node(node)
        neighbors.add_edge(center, node, distance=edge['distance'])
    nview = hv.Graph.from_networkx(neighbors, nx.layout.spring_layout)
    nview.opts(node_size=40)
    labels = hv.Labels(nview.nodes, ['x', 'y'], 'index')
    return (nview * labels.opts(
        text_font_size='10pt',
        text_color='white',
        bgcolor='white'
    ))

# Map all the nodes to their neighbors
#centers = {center: neighbor_graph(center) for center in sorted(graph.nodes)}
#hv.HoloMap(centers, kdims='node')

neighbor_graph('<01>')
[6]:
All the shortest Voice Leasing between two dichords
[7]:
# Generate a graph with all the shortest voice leading between two dichords
def shortest_voice_leadings(source, target):
    paths = nx.DiGraph()
    for path in nx.all_shortest_paths(graph, source=source, target=target):
        prev = None
        for node in path:
            paths.add_node(node)
            if prev:
                paths.add_edge(prev, node)
            prev = node
    pview = hv.Graph.from_networkx(
        paths,
        nx.layout.shell_layout
    )
    pview.opts(directed=True, node_size=30, arrowhead_length=0.05)
    labels = hv.Labels(pview.nodes, ['x', 'y'], 'index')
    return (pview * labels.opts(
        text_font_size='8pt',
        text_color='white', bgcolor='white'
    ))

# Map every pair nodes to all the shortest voice leading
#hv.DynamicMap(
#    shortest_voice_leadings,
#    kdims=['source', 'target']
#).redim.values(
#    source = sorted(graph.nodes),
#    target = sorted(graph.nodes)
#)

# Preselection for static html
shortest_voice_leadings('<39>', '<89>')
[7]:
Collection of shortest Voice Leading
[8]:
shortest_vl_path = None

# Generate a graph with a shortest voice leading between two dichords
def shortest_voice_leading(source, target, index):
    global shortest_vl_path
    paths = list(nx.all_shortest_paths(graph, source=source, target=target))
    if index >= len(paths):
        index = 0
        paths = [[source]]
    path = nx.DiGraph()
    prev = None
    for node in paths[index]:
        path.add_node(node)
        if prev:
            path.add_edge(prev, node)
        prev = node
    shortest_vl_path = path
    pview = hv.Graph.from_networkx(
        path,
        nx.layout.shell_layout
    )
    pview.opts(directed=True, node_size=30, arrowhead_length=0.05)
    labels = hv.Labels(pview.nodes, ['x', 'y'], 'index')
    return (pview * labels.opts(
        text_font_size='8pt',
        text_color='white', bgcolor='white'
    ))

# Map every pair nodes to a collection of shortest voice leading
#hv.DynamicMap(
#    shortest_voice_leading,
#    kdims=['source', 'target', 'index']
#).redim.values(
#    source = sorted(graph.nodes),
#    target = sorted(graph.nodes),
#    index = range(80)
#)

# Preselection for static html
shortest_voice_leading('<39>', '<89>', 50)
[8]:
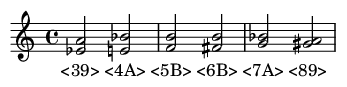
Generate a stream with the selection voice leading
[9]:
stream = Stream()
interval4 = Interval(4*12)
for node in shortest_vl_path.nodes:
    chord = node_to_chord[node].transpose(interval4)
    chord.addLyric(chord.normalOrderString)
    chord.duration.type = 'half'
    stream.append(chord)
# Render the resulting chord progression
renderWithLily(stream)
[9]:
[10]:
# Play the chord progression
playAudio(stream)
[10]: